Create a Sales Margin Report for all, one, or multiple Item Categories and Locations.
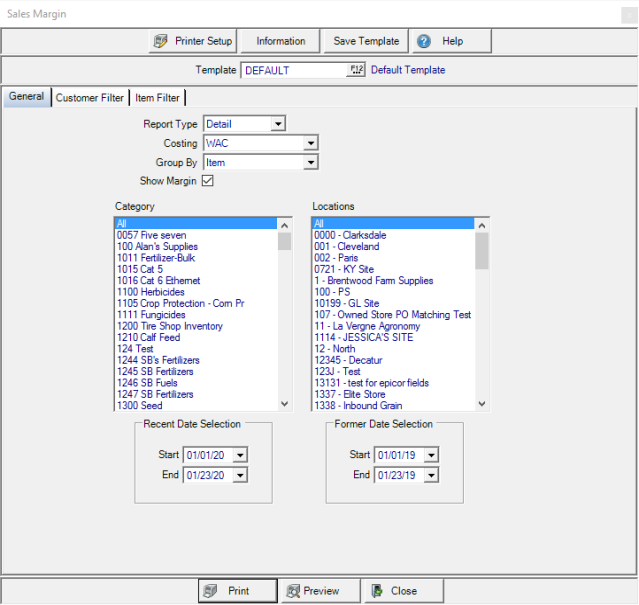
Create Your Report
Choose a Report Type of either
- Detail
- Summary
Use the drop down list in Costing to select WAC or Market/Contract.
Use the drop down list in Group By to select Item or Customer.
If Show Margin is selected, quantity columns will be included on the report.
In the Category section, choose All, one or multiple Item Categories.
In the Locations section, choose All, one or multiple Locations.
Recent Date Selection can be used to create a date range using the available drop down calendar or entering dates using the mm/dd/yy date format in both the Start and End date fields.
Former Date Selection can be used to create a date range using the available drop down calendar or entering dates using the mm/dd/yy date format in both the Start and End date fields.
Learn more about applying a Customer Filter here.
Learn more about applying an Item filter here.
Select Preview to view the report onscreen.
Select Print to send the report directly to the default printer.
Understanding Your Report
Below is a Summary version of the Sales Margin report.
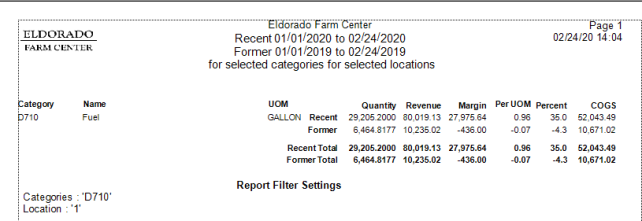
The Category ID and Name are listed on a Summary report.
On a Detail report, each Item ID and Description of the Item.
When running a Summary report, the default UOM for the Category is displayed. On Detail reports, each Item UOM is listed.
Quantity sold for the date ranges selected.
Revenue generated for the dates ranges selected for the Item.
Margin displays the difference between Revenue and Cost of Goods Sold.
The margin Percent calculated by dividing the Gross Margin amount by Revenue.
COGS indicates the Cost of Goods Sold
Recent and Former totals use the range of dates indicated in Recent and Former Date Selection.