Use an Inventory Turns report to determine the sales velocity of items for a selected date range. Customize the report by selecting a specific Location or Item Category.
| Access |
| Grant permission to User Profiles in Access User Profiles > select a User Profile > Menu Security > Reports module > Main Menu > Purchasing |
| Grant permission to the individual report > Purchasing > Inventory Turns |
Create Your Report
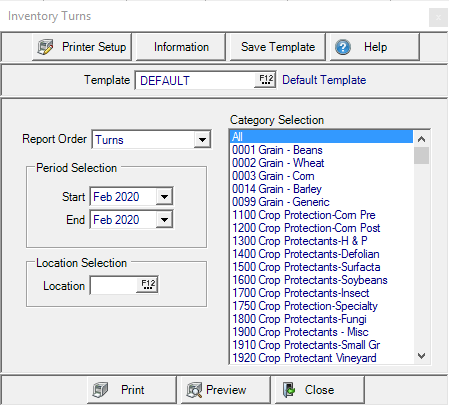
Use the drop down list in Report Order and choose
- Turns - Lists Items by Turns, lowest to highest.
- Item Description - List Items alphabetically by Item Description.
- Days in Inventory- Lists Items by Days in Inventory, highest to lowest.
- Management Index - Lists Items by Management Index, highest to lowest.
In Period Selection create a date range of Financial Periods.
- Start- Select a Start Period from the drop down list.
- End- Select an End Period from the drop down list.
Enter a Site ID in Location Selection or select F12 to search.
The Category Selection defaults to All or choose one or multiple Item Categories.
Select Preview to view the report onscreen.
Select Print to send the report directly to the default printer.
Understanding Your Report
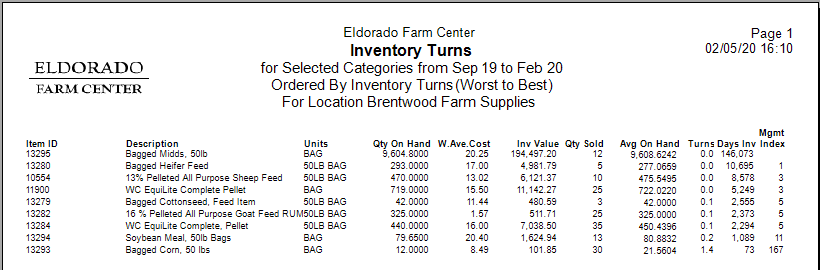
Item ID displays the Item ID and Item Description
Units is the Stocking Unit of Measure for the Item
Qty On Hand displays the Current Quantity on Hand of the item.
W.Ave.Cost, Weighted Average Cost, the current Weighted Average Cost of the Item.
Inv Value, Inventory Value, the quantity on hand multiplied by the Weighted Average Cost.
Qty Sold, Quantity Sold, the quantity of the Item sold for the date range on the report.
Avg. On Hand indicates the Average On Hand Quantity for the Item for the date range selected for the report. This is calculated using each day's end of day On Hand Quantity for the Item divided by the number of days within the date range.
Turns represents the length of time to completely sell the current On Hand Quantity and is calculated by dividing Quantity sold by the Average On Hand quantity for the date range selected.
| Item | Qty Sold | Ave On Hand | Turns |
| 13293 | 30 | 21.56 | 1.4 |
Days Inv- Number of days the item is in inventory.
Mgmt Index is calculated by using the Gross Margin percentage multiplied by the number of turns per year. To view the Gross Margin % on items, see the Margin Summary report.